Label annotating for human breast cancer dataset
Data preprocessing
[ ]:
import stSCI
import scanpy as sc
import numpy as np
import pandas as pd
import seaborn as sns

sc_adata = sc.read('data/human_brest_cancer/human_bc_scrna.h5ad')
st_adata = sc.read_visium('data/data/human_brest_cancer/hbc')
sc.pp.normalize_total(st_adata, target_sum=1e4)
sc.pp.normalize_total(sc_adata, target_sum=1e4)
sc.pp.log1p(st_adata)
sc.pp.log1p(sc_adata)
Model training
For label inference, user need to set the deconvolution parameter to True.
[2]:
sc_adata, st_adata = stSCI.train(sc_adata, st_adata, cluster_key='celltype_minor', cluster_method='louvain', clustering=True, deconvolution=True)
>>> INFO: Filtered 0 genes.
>>> INFO: Find 3000 same HVGs, result data shapes: [(40000, 3000), (2518, 3000)].
>>> INFO: Generate 17626 edges, 6.000 edges per spot (0.01s).
>>> INFO: Finish PCA (2.28s).
>>> INFO: Finish centroid generation (2.15s).
>>> INFO: Finish centroid generation (0.04s).
>>> Train stSCI: 100%|██████████| 500/500 [01:24<00:00, 5.89it/s]
>>> INFO: Generate 104172 MNN pairs, 2.604 pairs per SC cell; 41.371 pairs per ST spot (0.91s).
>>> INFO: Finish generate deconvolution result (0.21s).
>>> INFO: Train stSCI model (105.42s).
Generate the correlation matrix
We utilize the matrix generated from deconvolution results and categorize it by the clustering results to form the correlation matrix. To clearly illustrate the correlation of T cells within SC data, we specifically extract and visualize the portion of the correlation matrix for SC T cells.
[3]:
cluster_list = np.unique(st_adata.obs['cluster_result'])
sim_matrix = np.array([
    np.mean(st_adata.obsm['decon_result'][cluster == st_adata.obs['cluster_result']], axis=0)
    for cluster in cluster_list
])
sim_df = pd.DataFrame(sim_matrix, index=cluster_list, columns=st_adata.obsm['decon_result'].columns)
sns.heatmap(sim_df[['T cells CD4+', 'T cells CD8+']].T, square=True, cmap='viridis', linewidths=2, linecolor='white')
[3]:
<Axes: >
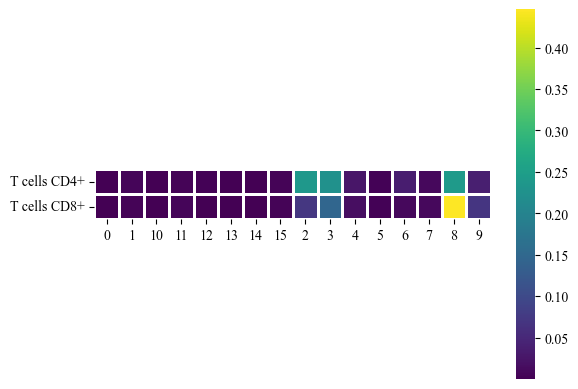
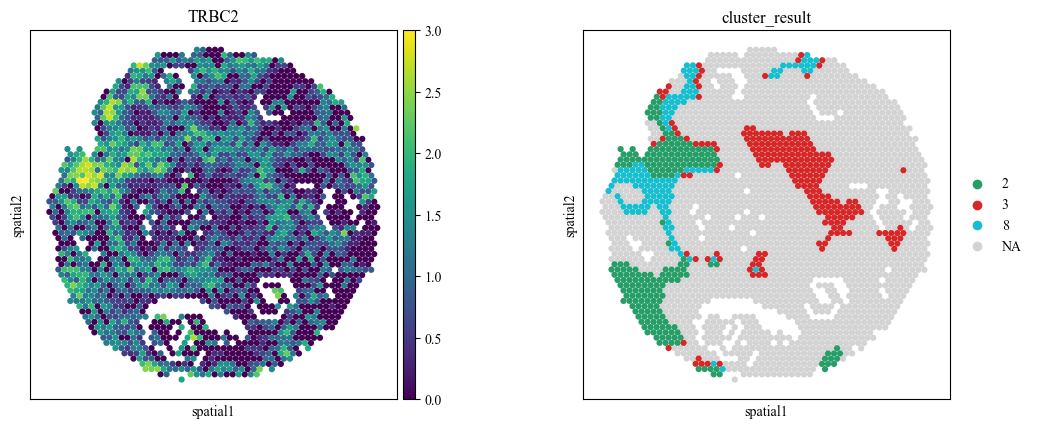
The correlation matrix shows that cluster 2, 3, 8 is high correlated with T cell. We visialized the T cell marker gene TRBC2 and the annotated T cell related spatial domain.
[4]:
sc.pl.spatial(st_adata, color=["TRBC2", "cluster_result"], groups=["2", "3", "8"], img_key=None, spot_size=300)